
How to compare the best BI tools before you commit
Most BI shortlists start with the same handful of names. On paper they all promise dashboards, AI features and easy data connections. The real differences show up later, when you need to embed analytics in your own product, roll a change out to hundreds of client workspaces, or explain to finance why the license bill grew with your user count. If you are evaluating the best BI tools for your team or your customers, those are the details to check before you sign.
Comparing the Best BI Tools is a side-by-side feature comparison for the people running that evaluation. That includes data and analytics leaders, product teams planning embedded analytics, and analytics engineers who want their BI layer to behave like the rest of their software stack.
What this business intelligence software comparison covers
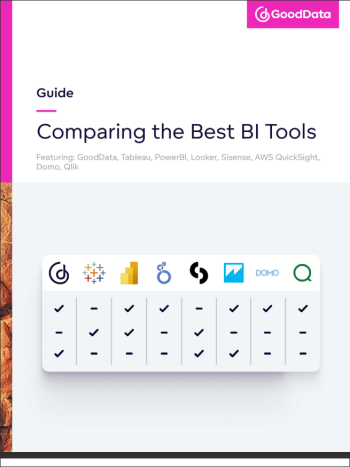
The core of the document is a set of feature tables. They line up eight widely used analytics platforms, including Tableau, Power BI and Looker, against the same criteria. You get a simple yes-or-no view of which platform supports what, grouped into nine areas:
- Architecture, from cloud-native deployment to semantic models and multitenancy
- Dashboards and self-service for non-technical users
- Embedding options, such as JavaScript libraries and web components
- Scaling and change management across many user groups
- AI and ML features, including natural language query
- Data integration, security and compliance, deployment, and pricing
Read across a row and you can quickly see which tools meet a hard requirement. Read down a column and you get a sense of where each platform is strong and where you might need workarounds.
A short primer comes before the tables. It explains what BI tools do and why the choice has lasting consequences. It covers faster decisions through augmented analytics, the reuse of metrics and reports, and keeping costs under control as your data grows.
Questions it helps you answer during vendor selection
A feature list is only useful when it maps to a real decision. After reading, you'll be able to check whether a platform lets you change your data warehouse without rebuilding metrics and dashboards. You'll also see whether analytics definitions can be versioned and managed as code, and whether pricing for external users is tied to seats, queries or sessions. Those three questions alone can reshape a shortlist, especially for SaaS companies that offer analytics to their own customers.
The comparison also covers self-hosting versus a fully managed cloud, the compliance standards each vendor supports, and whether there is a realistic entry point for smaller teams. Those points often decide a deal late in the process, so it helps to see them early.
Built by an analytics vendor, with its own platform explained
GoodData produced the guide and says so openly. After the comparison, it explains GoodData's own approach in more detail. That section covers analytics as code with CI/CD and version control, multi-tenant analytics built on parent and child workspaces, an intelligent caching layer called FlexQuery, natural language querying for business users, and a pricing model with both workspace and user options.
If GoodData is already on your list, this section gives you a concrete picture of how the platform works. If it isn't, it still shows what these capabilities look like in practice, which makes it easier to ask sharper questions in other vendor demos. The feature assessments are based on publicly available information as of April 2025.
Download the full guide to see every feature table side by side and check how each platform handles the requirements that matter to your project. You'll come away with a reference you can bring into your next vendor review, and a faster route from a long list of options to a shortlist you can defend.