
Business Intelligence Comparison Guides, Resources and White Papers

Top Business Intelligence Trends and Strategies for 2026
Business intelligence is shifting from dashboards that report what happened to agents that explain why and act on it. This Snowflake e-book examines five trends reshaping BI in 2026: conversational AI-powered analytics, the semantic layer as a single source of truth, agentic BI embedded in operational workflows, autonomous cost optimization, and trust built through governance and lineage. Each trend comes with a strategy and a 2026 checklist, covering steps such as seeding verified queries, planning for the Open Semantic Interchange (OSI), auditing embedded-view latency, setting budgets and alerts, and mapping controls to the NIST AI RMF. A reference architecture for agentic BI shows how semantics and AI agents sit between raw data and consumption. Read it to assess whether your data foundation is ready for agents that are accurate, cost-efficient and auditable.
The Snowflake vs. Databricks breakdown
Two of the most dynamic and fastest-growing companies in the big data world - Snowflake and Databricks - have quickly risen to prominence by building their platforms around truly innovative concepts. Both organizations have established themselves as leaders by delivering expansive, constantly evolving sets of features supported by unique designs and architectures tailored to the demands of modern data-driven enterprises. At their core, these platforms provide the essential functions of storing vast amounts of data, ingesting and transforming it into usable formats, and generating powerful analytics that help businesses unlock insights and drive strategy. However, within those broad capabilities, each platform offers specialized strengths and nuanced differences that make them better suited for particular organizational strategies and technology roadmaps. Recognizing that choosing between them can feel overwhelming, Wavicle’s team of expert cloud data consultants developed a comprehensive guide designed to serve as a practical, comparison-based starting point, helping organizations evaluate which solution is the best fit for their unique needs and long-term goals.
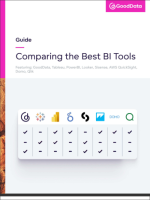
Comparing the Best Business Intelligence (BI) Tools
Choosing the right BI tool is a bit like finding the perfect business partner - it needs to be smart, reliable, and help you uncover opportunities you might otherwise miss. Today's top business intelligence (BI) platforms do more than just crunch numbers. They turn raw data into clear insights, helping teams make faster, smarter decisions. But with so many options out there, how do you pick the best BI solution for your business? In this article, we'll break down some of the best BI tools on the market - Tableau, Power BI, Looker, Sisense, Quicksight, and GoodData - and see how they stack up. Whether you're focused on ease of use, AI features, or getting the most value for your investment, this comparison will help you find the right fit.
Power BI vs. Tableau: Which is The Better Business Intelligence Tool in 2025?
Power BI and Tableau are two of the most widely used business intelligence tools, each offering unique strengths for data science and analytics tasks. Power BI, developed by Microsoft, integrates seamlessly with other Microsoft products like Excel and Azure, making it ideal for organizations already invested in the Microsoft ecosystem. It offers a user-friendly interface and affordable pricing, which appeals to small- and medium-sized businesses. Tableau, on the other hand, is known for its advanced data visualization capabilities and flexibility in handling large, complex datasets from multiple sources. It provides more customization and interactivity for in-depth data analysis, which data professionals often prefer. Ultimately, the choice between Power BI and Tableau depends on your specific needs—whether you prioritize cost-efficiency and ease of use (Power BI) or advanced analytics and visualization power (Tableau).
The Core Question: Qlik Sense or Power BI?
Choosing between Qlik Sense and Power BI is a key decision for organizations aiming to harness data for smarter business decisions. A downloadable white paper comparing the two platforms offers an in-depth analysis of their strengths, including ease of use, data visualization capabilities, integration options, and scalability. It explores how Qlik Sense's associative data model supports flexible exploration of complex data, while Power BI's tight integration with Microsoft tools and familiar interface makes it a strong choice for Office 365 users. This guide helps decision-makers understand which platform aligns best with their technical needs, user base, and strategic goals. Download the white paper to gain valuable insights and make an informed choice.